Case Example: Cal Athletics FY25–FY27
A CFO-level interpretation of Cal Athletics’ structural drivers, institutional support dynamics, and the operating model shifts required in the NIL era.
“The best way to predict the future is to create it.”
— Abraham LincolnOperating Reality
Cal Athletics’ multi-year outlook shows a persistent structural gap: expenses outpace available resources even as transfers remain significant. The CFO mandate is to stabilize liquidity, align governance, and modernize decision intelligence.
FY23–FY27: Resources vs Expenses
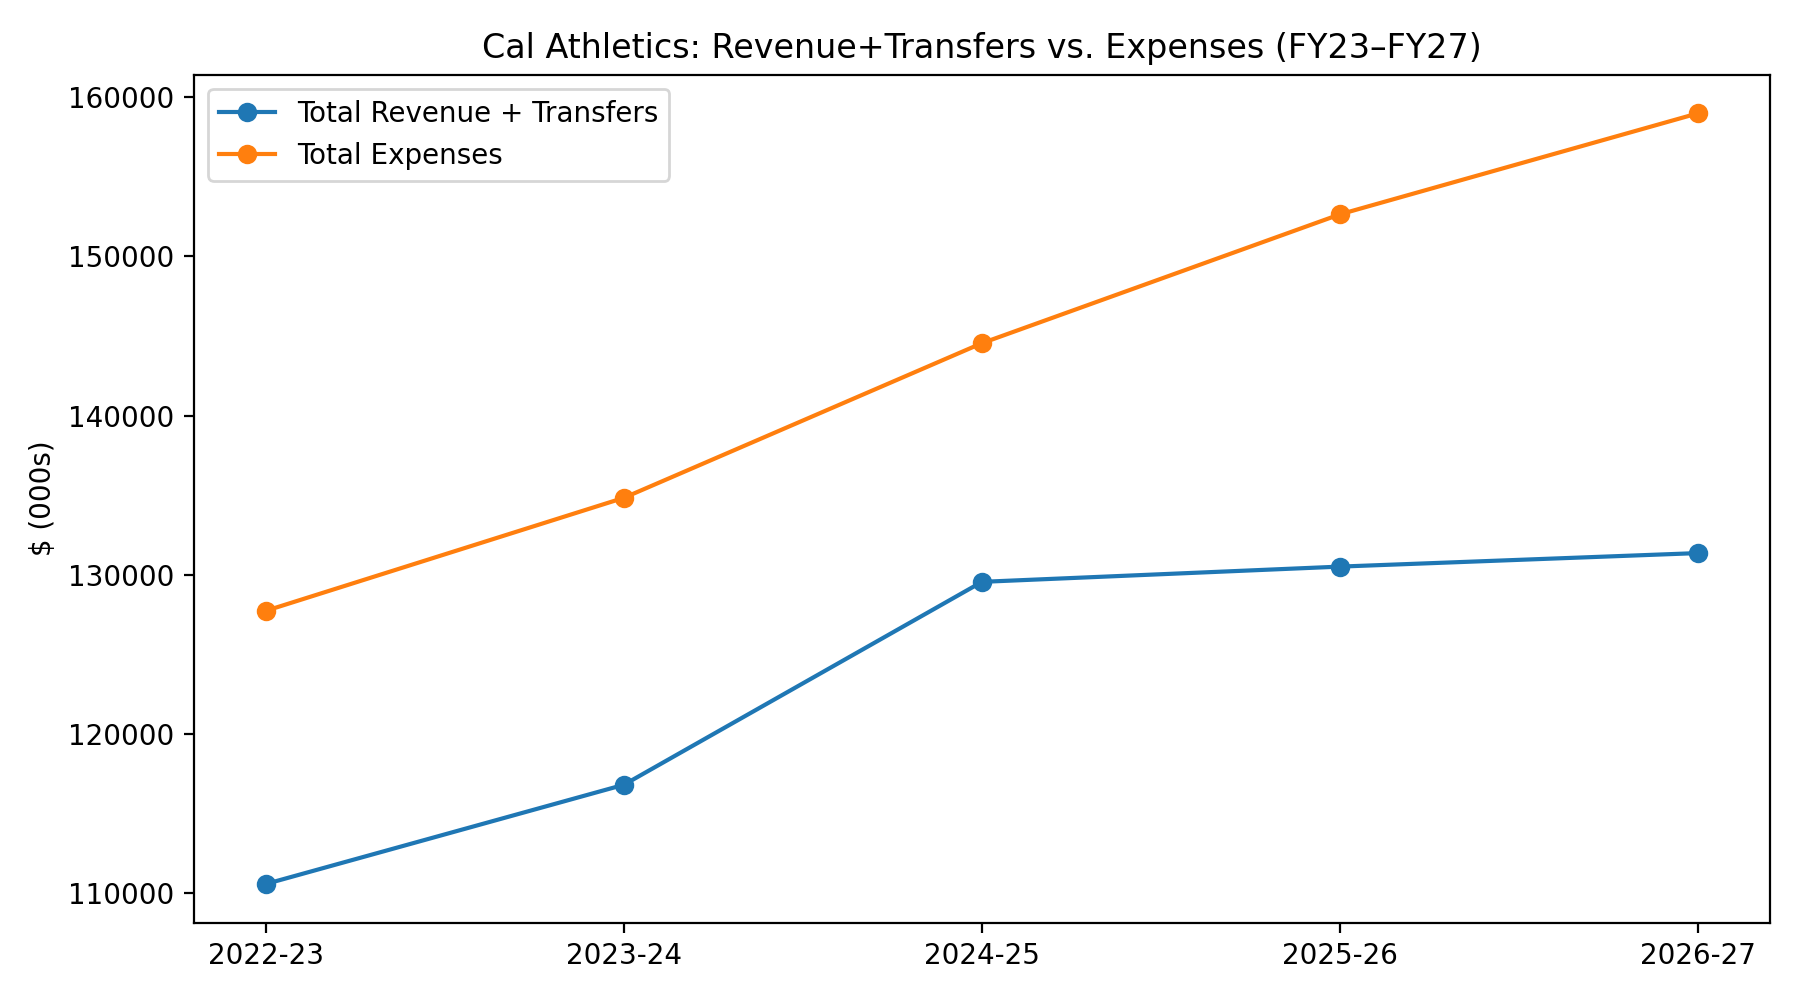
Use as the primary “structural gap” visual in board materials.
FY23–FY27: Net Operating

Frames urgency without assigning blame: the model is shifting.
Dependence on Transfers
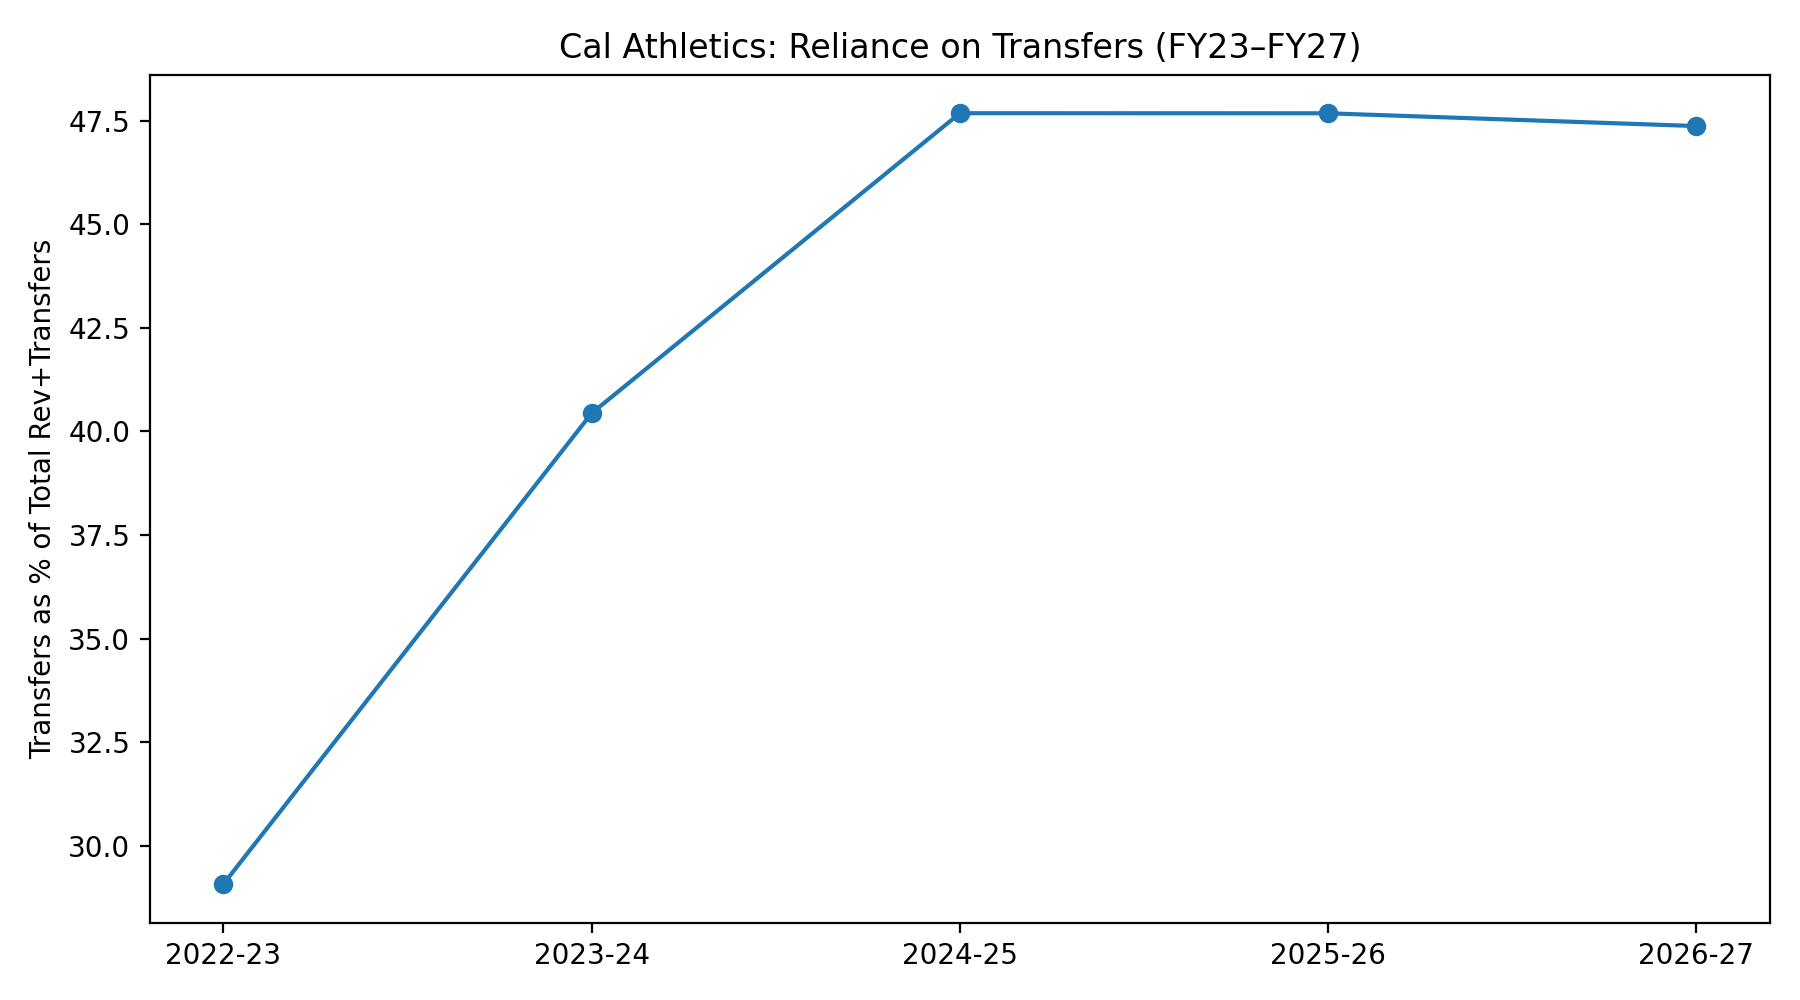
A governance metric: explains why transparency and logic matter.
Ending Balance Trajectory
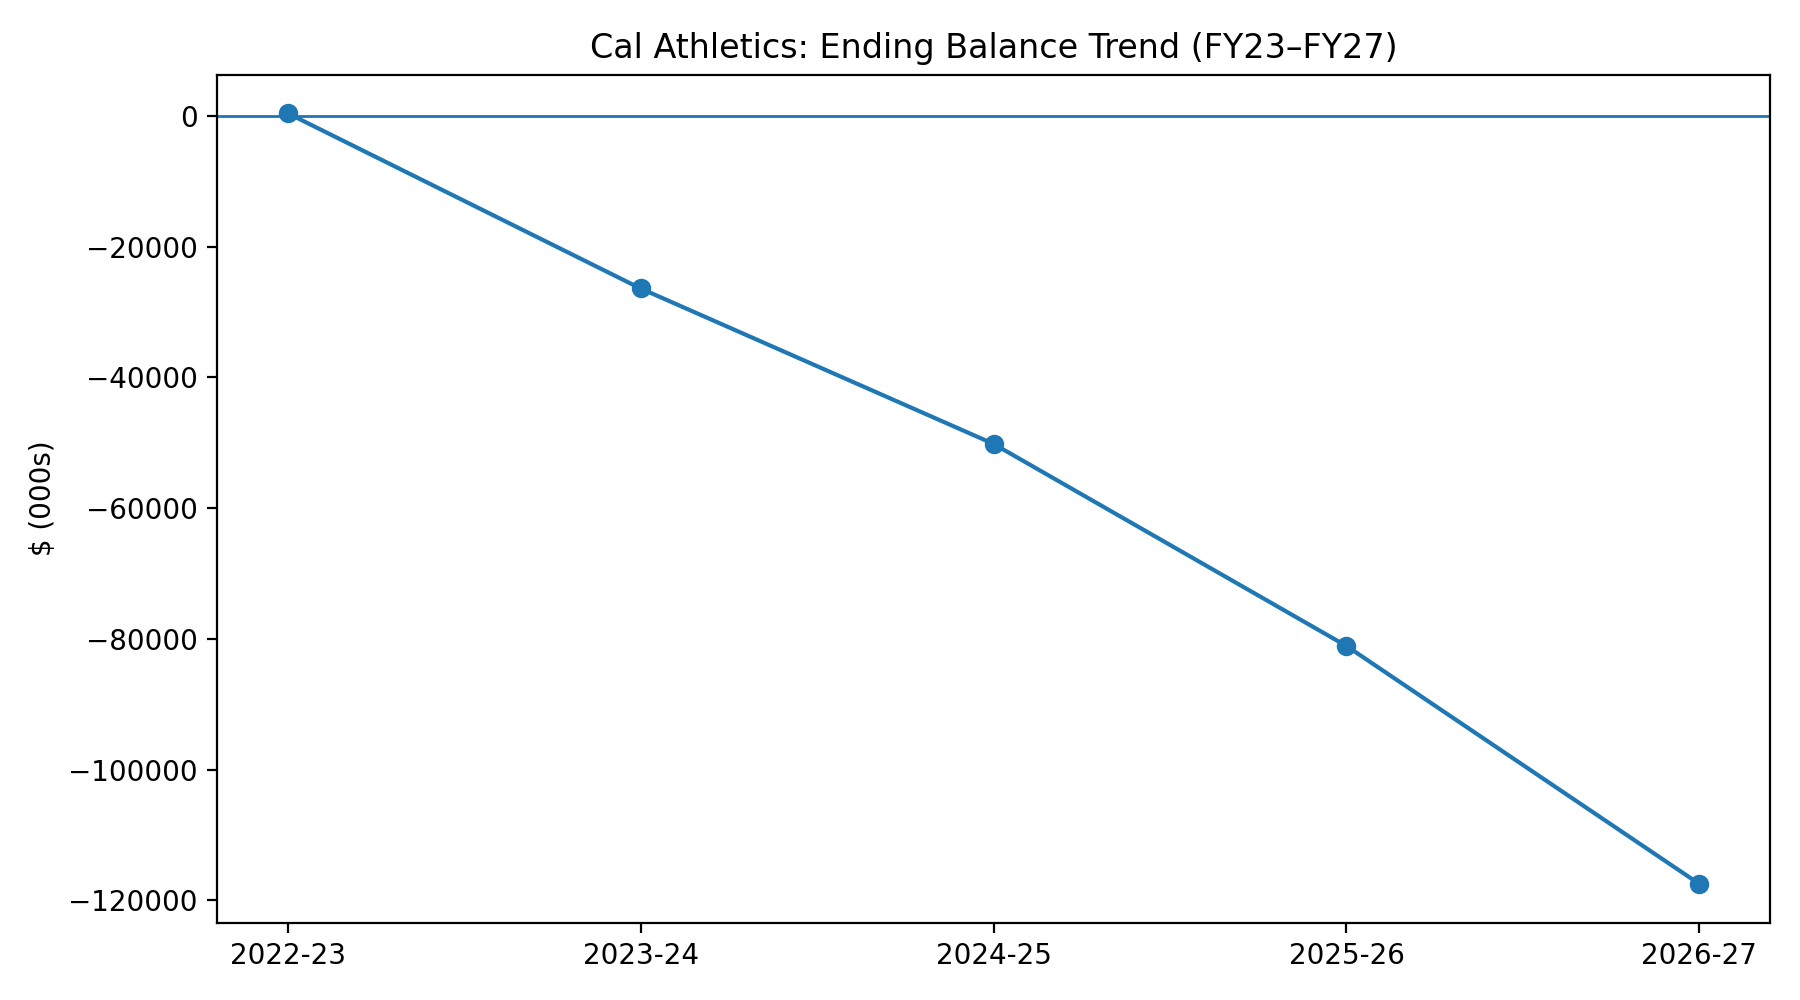
A liquidity signal: identifies the need for stabilization plans.
Dashboard View (Historical + Baseline)
This dashboard mockup integrates historical revenue/expense trends with the FY25 baseline. It is designed to become a Power BI/Tableau artifact with drilldowns by sport, unit, and revenue engine.
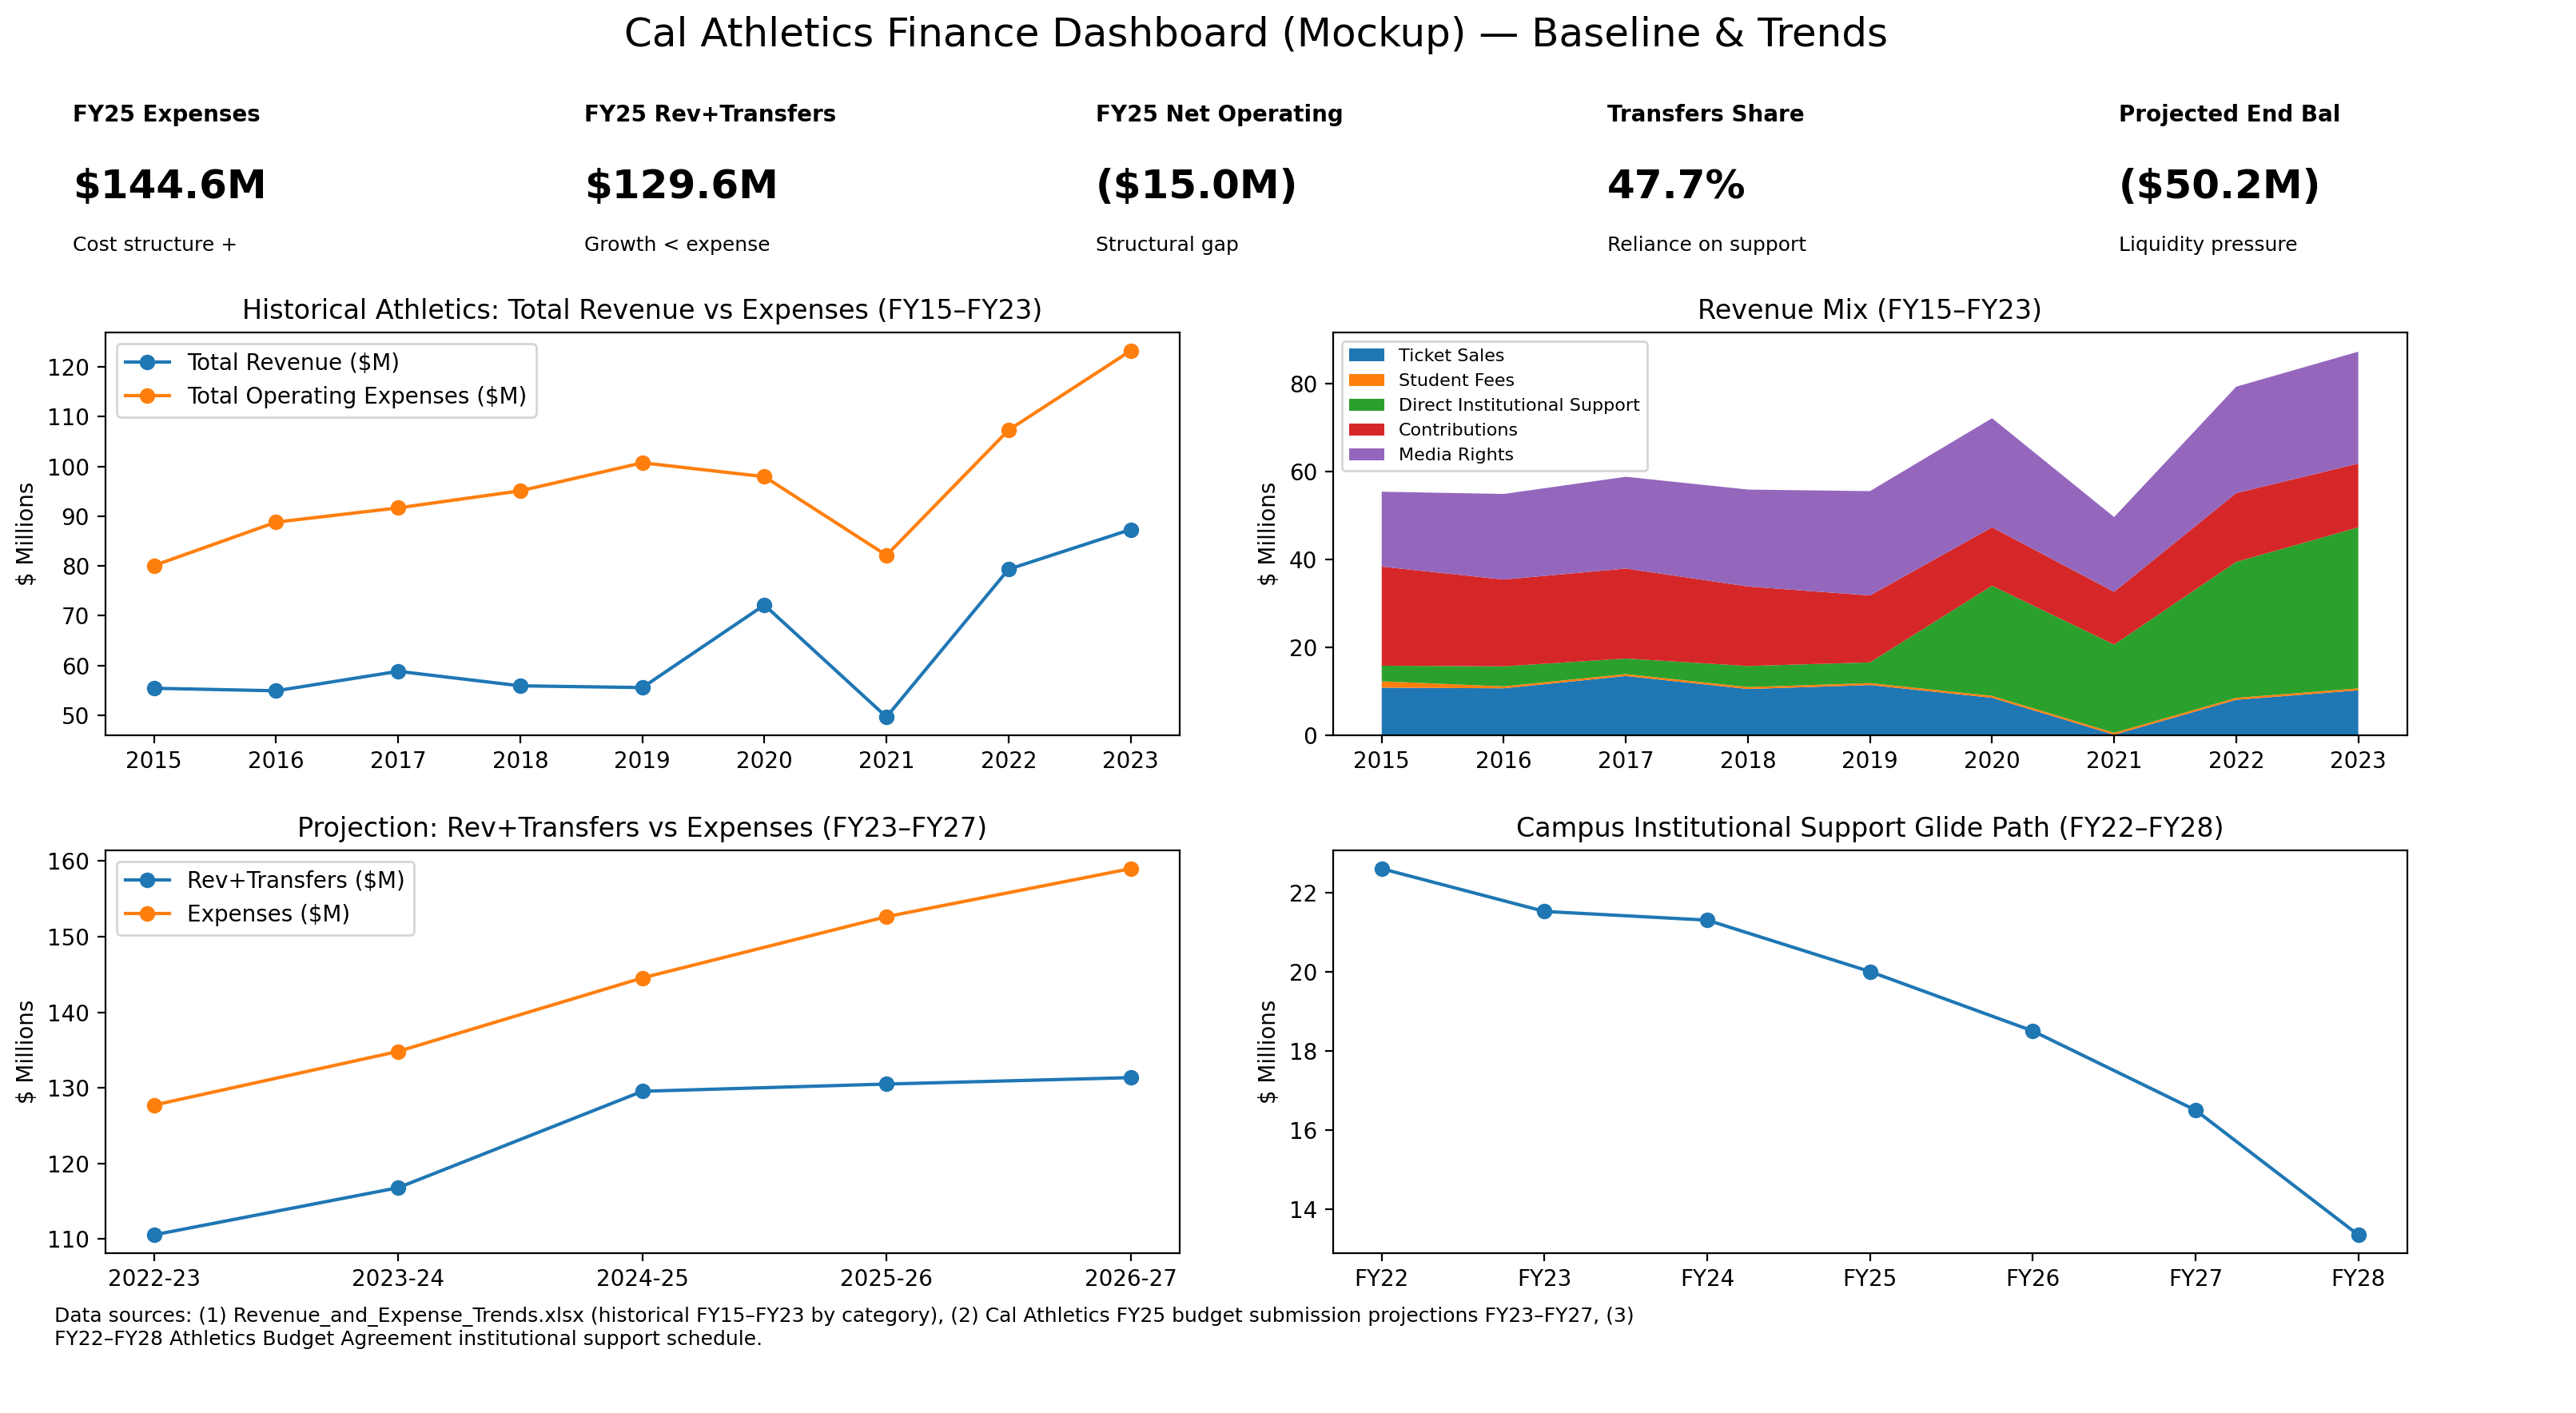
Implementation note: the KPI set should include forecast accuracy and variance drivers to support governance cadence.